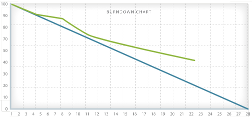
6 issues identified through Burndown Charts
I am assuming that you understand what a Burndown chart is and how to read it. If not have a look at wikipedia or InfoQ. A burndown chart is an excellent mechanism to visualise the progress of a project, and can provide early feedback on the progress of a project or sprint. Below are 6 potential issues, and how to identify them using burndown charts.
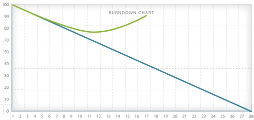
| 1. DiscoveryThis chart shows that new (I'm assuming critical) tasks have been identified or the task estimation has been refined at the start of the sprint (after planning). Watch the progress carefully as this will impact your sprint deliverables and velocity. |
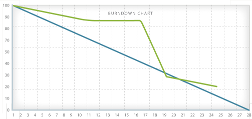
| 2. Scope CreepThis chart shows tasks being added mid-release and is a major problem. While agile embraces changes in scope, this does not extend to within the sprint itself. |
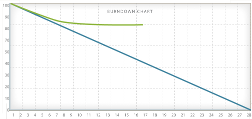
| 3. PlateauThis chart shows that features are not being completed (possibly due to poor estimation) or that there has been unexpected staffing issues. It is unlikely that you will complete all tasks in the sprint, so consider reducing the scope or calling an early end to the sprint. |
| 4. Too Many FeaturesThis chart shows that there are too many features assigned to the sprint and thus that your estimation needs significant improvement. Like 3, it is unlikely that you will complete all tasks in the sprint, so consider reducing the scope or calling an early end to the sprint. |
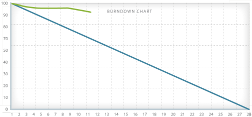
| 5. Tracking EpicsThis is very common and shows that individual tasks/stories in the sprint are too large and difficult to track. Remember that burndown charts are only updated once a task is complete. This is also the easiest to solve by ensuring that all tasks in a sprint are under 1 day/unit of work. You will notice that issues 3 and 5 are almost identical and it can be hard to know when you have reached a true plateau until the end of a sprint. |
| 6. Poor EstimationSimilar to 4, this chart generally shows that features are slightly more difficult than estimated. In this situation finish the sprint as best as possible, and ensure you review the estimation process during the retrospective. This is just a few of the potential issues that can befall an iteration or a project. I’d love to hear from anyone who has seen other issues. |

